


Outbuild is online scheduling software to work together on connected project schedules and look-aheads, enabling everyone to move faster.
Key Takeaways

- Schedules, Lookaheads, and Weekly Work Plans within one integrated platform.
- Real-time insights and project analytics through automated dashboards.
- Easier, streamlined plan management through a user-friendly interface.
Table of contents
- The Problem With the KPIs Most Teams Already Use
- How to Use These KPIs in the Planning Rhythm
- Category 1: Commitment Reliability, Is the Near-Term Plan Real?
- Category 2: Constraint Health, Is Work Actually Getting Ready?
- Category 3: Milestone Path Health, Are You Protecting the Dates That Matter?
- From Reporting the Past to Protecting the Future
- Do This Monday: A Five-KPI Starter Set
A color-coded schedule is not a healthy schedule. It is a formatted one.
That difference matters. A schedule can look clean, baseline-approved, and regularly updated while the project quietly drifts toward a missed date. Not because the data was missing. Because the team was watching the wrong signals.
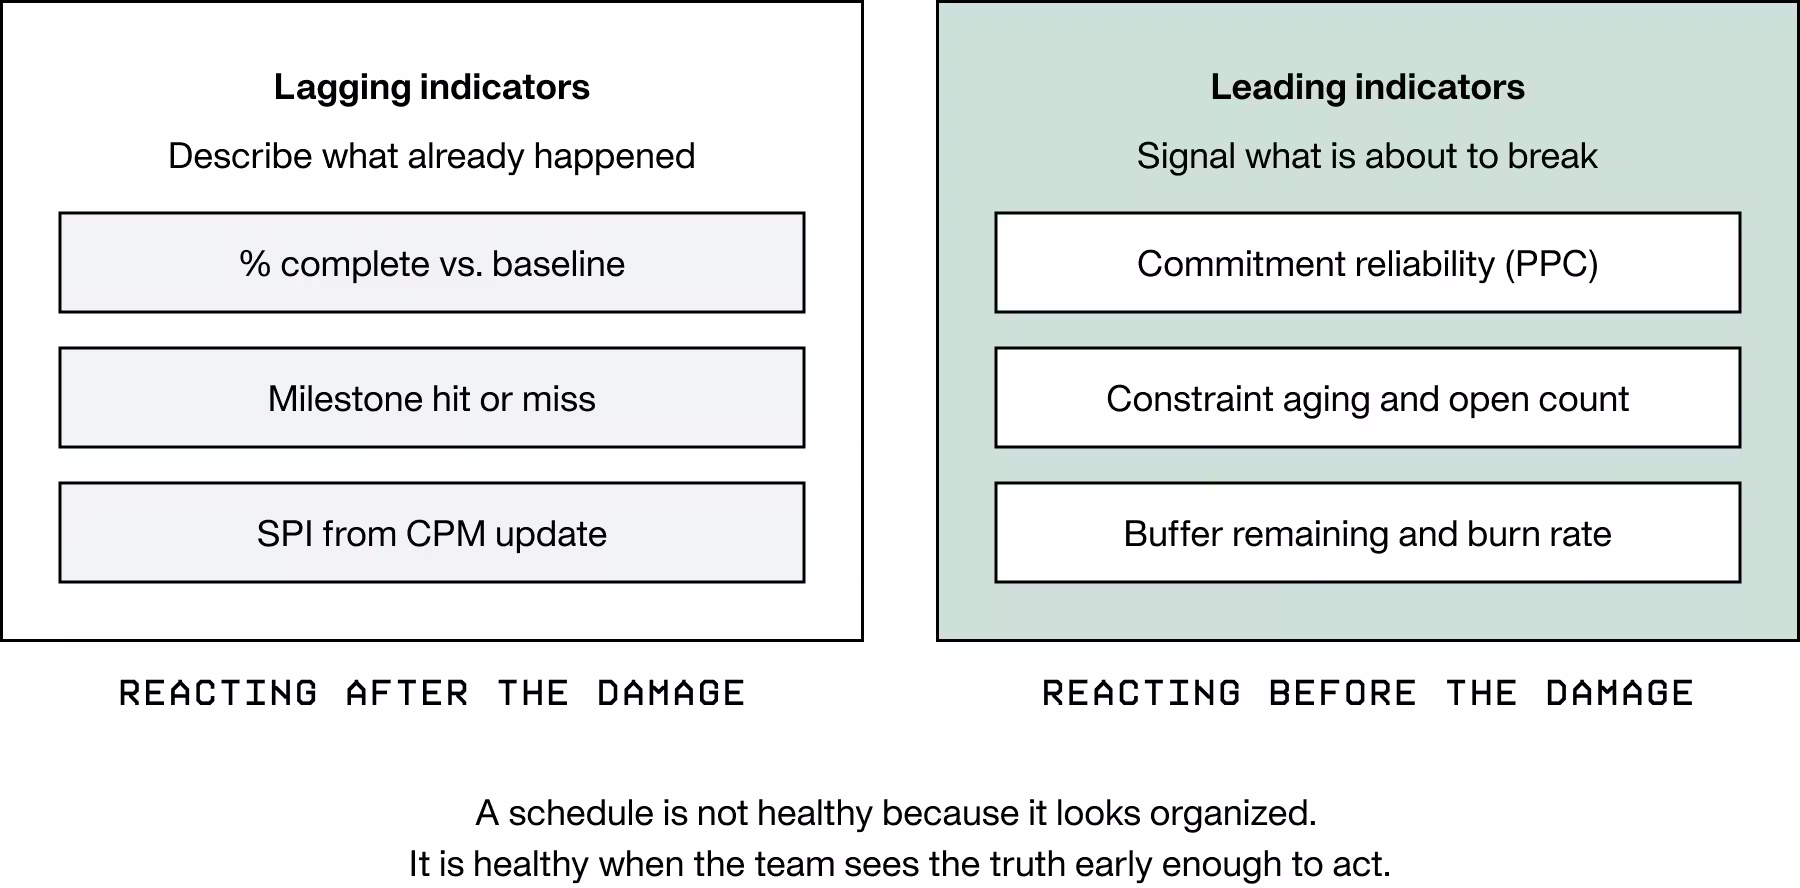
Many schedule reports still rely too heavily on lagging indicators such as percent complete against baseline, milestone hit or miss, and Schedule Performance Index. Those metrics can help describe what has already happened. By themselves, they usually do not tell the team early enough what is starting to break.
That is why so many projects discover schedule trouble in a monthly review, after the update is published and after recovery options have already become more expensive.
Schedule health is not just a report. It is a pattern of behavior that can be measured week over week through signals that appear before a milestone starts to move.
The one-sentence answer
The most useful schedule health KPIs combine commitment reliability, constraint health, and milestone path health so the field and office can see problems early and adjust before key dates are exposed.
These three categories answer the same underlying question from different angles: is the plan actually executable?
These KPIs only matter if they live inside a routine.
- Commitment reliability belongs in the weekly work plan review.
- Constraint health belongs in the lookahead and make-ready process.
- Milestone path health belongs in milestone and phase review discussions.
When each KPI sits inside a planning rhythm, the team can act on it instead of just reporting it.

Commitment reliability is one of the clearest early indicators of whether the near-term plan is executable.
If weekly promises are not being kept, the project may still look stable in a formal schedule update, but field reliability is already weakening. That matters because the weekly plan is what feeds the phase plan, and the phase plan is what protects the milestone.
Three metrics that show whether promises are being kept
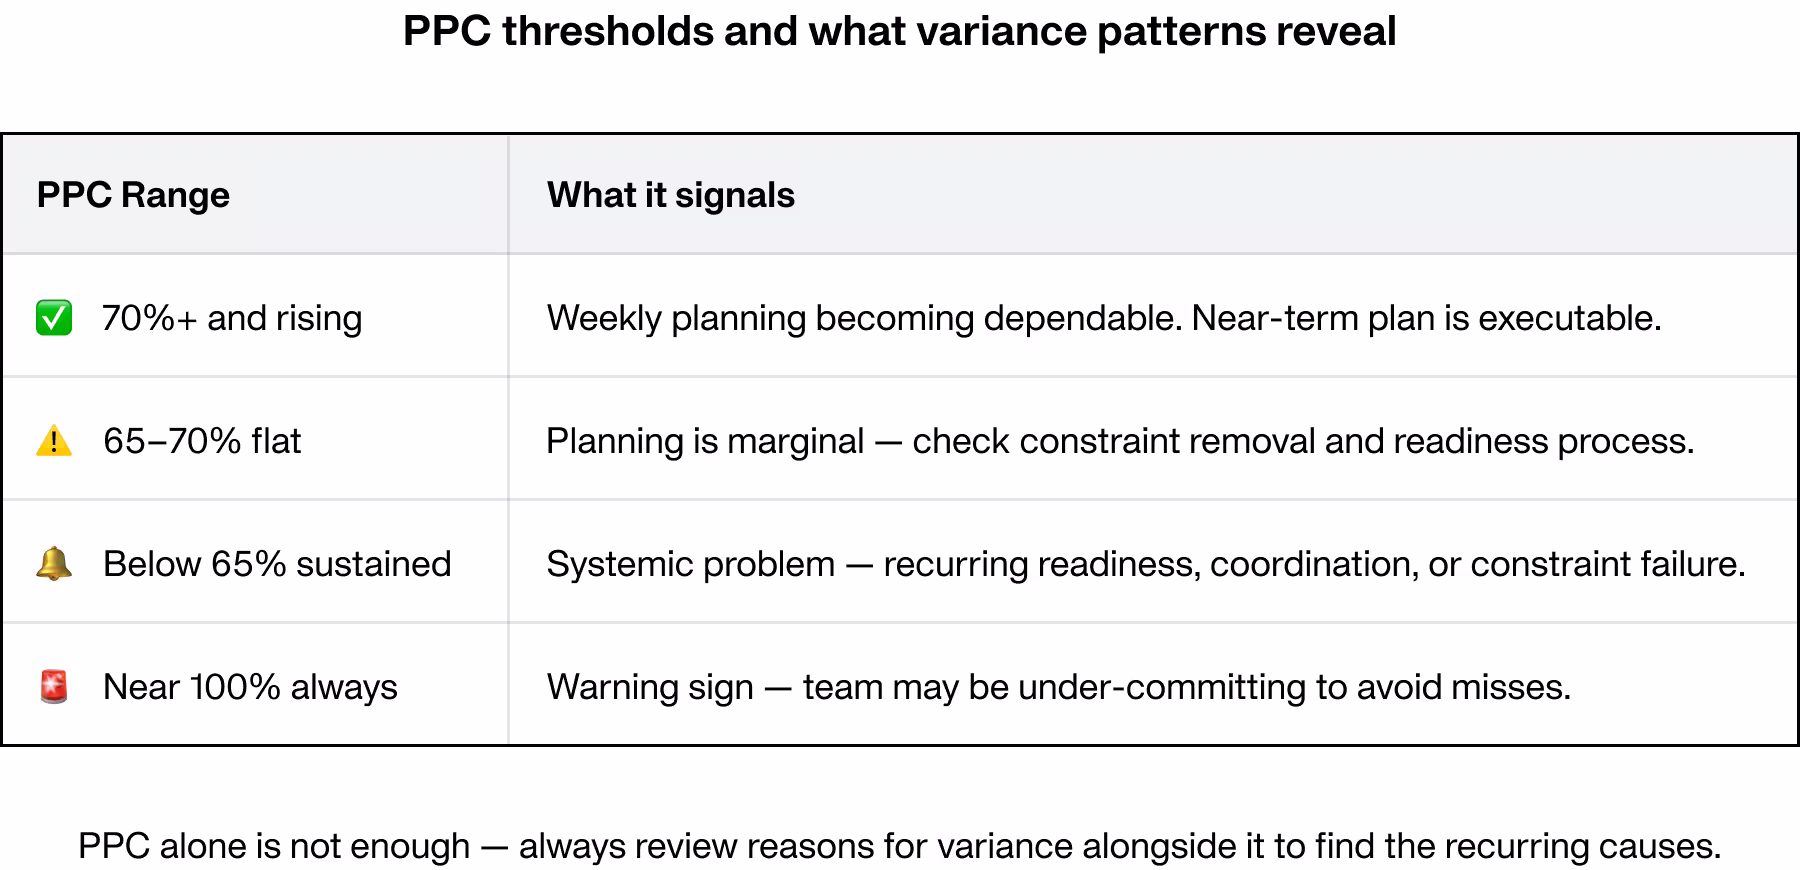
1. Percent Plan Complete, PPC
PPC measures the share of weekly commitments completed as promised.
It is simple, binary, and useful for showing whether weekly planning is becoming more reliable.
In Lean construction practice, PPC is used as an indicator of planning reliability. Many teams view roughly 70 percent or better as a useful sign that weekly planning is becoming dependable, while repeated very high results can also suggest under-committing.
If PPC stays below roughly 65 percent for several weeks, the issue is usually bigger than one weak weekly plan. It often points to recurring readiness, coordination, or constraint problems in the system.
2. Reasons for variance
Every missed commitment should have a logged reason, not to assign blame, but to identify recurring causes.
Typical categories include:
- design information not available
- predecessor incomplete
- material not delivered
- access problem
- labor shortfall
- equipment issue
- inspection delay
- weather
On many projects, a small number of recurring causes drive a large share of missed commitments. That is why regular review of reasons for variance is so useful. It helps the team focus on the causes that most often break the plan.
3. PPC by trade and area
Review reliability by trade and by area to identify where the plan is repeatedly breaking down.
This should be used for pattern recognition, not trade scorekeeping. A recurring reliability problem in one area may be caused by logistics, predecessor work, or information flow, not just one trade’s performance.
Commitments measure what the team promised and delivered. Constraints measure whether the work was truly ready in the first place.
Constraint health is one of the strongest leading indicators a project team can track because blocked work shows up before the missed commitment and well before the milestone slip.
Constraint metrics matter most when each blocker is tied to a needed-by date and a specific handoff or milestone.
Four constraint metrics that replace surprises with signals
1. Constraints opened versus closed per week
This ratio answers a simple question. Is the team clearing blockers faster than new ones are appearing?
If constraints are closing faster than they open, the project is getting healthier. If the opposite is happening, the team is building hidden schedule exposure.
2. Constraint aging
How long does an average constraint sit open before it is resolved?
Constraint aging makes invisible drag visible. A practical rule of thumb is to review any blocker that remains open beyond its needed-by date, or that has been unresolved for about a week without a clear escalation path.
The longer a blocker sits unresolved, the more likely it is to compress downstream work, disrupt crew planning, and force expensive recovery moves later.
3. Constraint hit rate
This measures the share of missed commitments caused by constraints that were already known but were not cleared in time.
A high constraint hit rate means the team could already see many of the blockers causing missed work but still did not resolve them fast enough. That points to a process problem, not just a visibility problem.
4. Top constraint types
Group constraints by type and track which ones recur most often.
Typical categories include:
- RFIs and design clarifications
- submittals and approvals
- long-lead procurement
- inspections and quality hold points
- access and logistics
- manpower
- predecessor work
The most common constraint types on a project usually reveal its structural schedule risks. Those patterns should be reviewed at the leadership level and managed proactively.

The first two categories show whether near-term work is reliable. This third category shows whether that reliability, or lack of it, is starting to affect milestone protection.
This is the category that connects field execution to executive accountability.
Three milestone path metrics that matter most
1. Milestone forecast variance
Is the projected completion date for the next milestone drifting week over week, and by how much?
The most important signal is trend, not just current position. A milestone that is four days late but stable for three weeks is in a different condition than one that is four days late and slipping further each week.
2. Buffer remaining on the milestone path
For weekly and executive conversations, many teams find it helpful to translate float and forecast movement into simpler milestone protection language such as buffer remaining.
This shows how much schedule protection remains between current performance and the committed milestone date.
3. Buffer burn rate
Buffer burn rate shows how quickly that milestone protection is shrinking based on actual weekly performance.
It converts an abstract schedule condition into a practical forecast. If the current rate continues, how long before the milestone loses its protection?
When forecast variance, buffer remaining, and buffer burn rate are reviewed together, the conversation gets better. The team stops asking only whether the date is still on track and starts asking what needs to change this week to protect it.
The shift these KPI categories create is practical, not cosmetic.
A project that measures only lagging indicators is mostly reacting to history. Every action starts after a problem has already affected the schedule.
A project that tracks commitment reliability, constraint health, and milestone path health is working with earlier signals. Problems surface while they are still small enough to manage. Decisions happen while options still exist.
The goal is not a prettier dashboard. The goal is a team that sees the same signals, asks the same questions, and responds together, field and office, while there is still time to matter.
How to Fix the Disconnect Between the Office and Field.
Download the report to learn more:
- Learn about the why scheduling and planning fail the field
- Understand the pain points, inefficiencies, and evolving practices shaping scheduling today
- Find out how to bridge critical disconnects happening in construction
You do not need a new platform to start measuring schedule health this week. Start with five numbers, track them consistently, and review them together.
- Percent Plan Complete, PPC. Did the team do what it committed to this week?
- Constraint aging. How long has each open blocker been sitting, and who owns clearing it?
- Constraints opened versus closed. Is the project getting healthier or accumulating more risk?
- Milestone forecast variance. Is the next key date holding, drifting, or slipping further each week?
- Buffer remaining and burn rate. How much protection is left, and how quickly is it being consumed?

If those five measures are moving in the right direction, the team is more likely to catch schedule trouble early. If they are deteriorating, the project should treat that as an early warning and respond before the next monthly review.
A schedule is not healthy because it looks organized. It is healthy when the team can see the truth early enough to act on it.
How to Fix the Disconnect Between the Office and Field.
You do not need a new platform to start measuring schedule health this week. Start with five numbers, track them consistently, and review them together.
- Percent Plan Complete, PPC. Did the team do what it committed to this week?
- Constraint aging. How long has each open blocker been sitting, and who owns clearing it?
- Constraints opened versus closed. Is the project getting healthier or accumulating more risk?
- Milestone forecast variance. Is the next key date holding, drifting, or slipping further each week?
- Buffer remaining and burn rate. How much protection is left, and how quickly is it being consumed?
If those five measures are moving in the right direction, the team is more likely to catch schedule trouble early. If they are deteriorating, the project should treat that as an early warning and respond before the next monthly review.
A schedule is not healthy because it looks organized. It is healthy when the team can see the truth early enough to act on it.
Frequently Asked Questions
Schedule health means the team can see the truth early and respond while options still exist. A clean, updated schedule does not prove health. Reliable execution does.
They are lagging indicators. They describe past performance and often surface schedule trouble after recovery gets harder and more expensive.
PPC, Percent Plan Complete, measures the share of weekly commitments completed as promised. Many Lean teams treat around 70 percent or better as a sign weekly planning is becoming dependable. Several weeks below roughly 65 percent points to a system issue, not one bad week.
Start with constraints opened vs closed per week, constraint aging, constraint hit rate, and top constraint types like RFIs, submittals, long-lead items, inspections, access, manpower, and predecessor work.
Track milestone forecast variance week over week, buffer remaining on the milestone path, and buffer burn rate. Together, these show whether the dates that matter are protected or getting exposed.


Ready to see Outbuild?
Join hundreds of contractors from 10+ countries that are saving money by scheduling better

We’ll be in touch soon!