

Outbuild is online scheduling software to work together on connected project schedules and look-aheads, enabling everyone to move faster.
Key Takeaways

- Schedules, Lookaheads, and Weekly Work Plans within one integrated platform.
- Real-time insights and project analytics through automated dashboards.
- Easier, streamlined plan management through a user-friendly interface.
Table of contents
- Why CPM Often Stays in the Office, and What That Costs the Field
- Step 1: Stop Leading With the Full Schedule. Start With the Milestone Path.
- Step 2: Translate Float Into a Field-Friendly Condition Signal
- Step 3: Show Critical Work by Area, Not Just by Logic Network
- Step 4: Connect the Milestone Path to Weekly Commitments
- When the Field Can See It, They Can Protect It
- Do This Monday: A Field-Ready Checklist
Ask a scheduler what is critical on a project and they will open a Gantt chart. Ask a superintendent the same question and they will usually answer from what they have been fighting all week.
The issue is not that field teams do not understand schedule risk. The issue is that the schedule information they need is often trapped inside a format built for logic analysis, forecasting, and reporting, not for daily field decisions.
When critical path lives only in the scheduler’s file, the people who could actually protect it do not see it early enough.
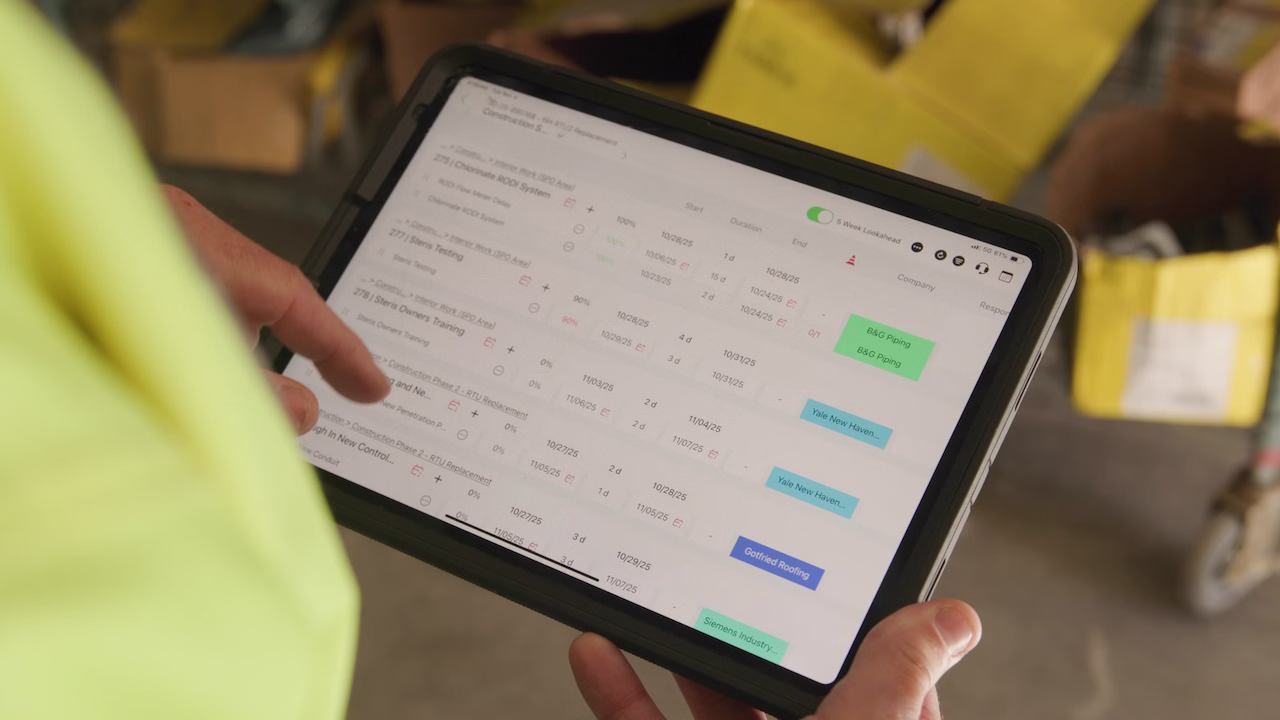
On many projects, the CPM schedule is maintained in P6 or MS Project by someone in the office. The critical path is technically defined in that schedule. Float is calculated there too.
Meanwhile, the field often runs the near-term job through a three-week lookahead, a whiteboard, a spreadsheet, and the working knowledge of supers and foremen.
That is where the disconnect shows up. The office may say an activity still has float. The field may say the work is blocked and the handoff is already in trouble. Both perspectives can be valid, but neither helps much if the field cannot see schedule-driving work in a form it can act on.
The problem is not CPM itself. The problem is that the field is often expected to act on schedule data that was never translated into a field-usable view.
A full CPM schedule is built for logic control, forecasting, and status. The field needs a simpler view that shows what is driving the next milestone, where the risk sits, and what decisions need to happen this week.
The One-Sentence Answer
The most useful way to visualize float and critical path for the field is to translate milestone-driving work into a simple area-based view that shows what is driving the next milestone, what is at risk, and what decisions need to happen this week, using plain-language signals instead of scheduling jargon.
The goal is not to replace CPM logic or scheduler analysis. The goal is to give the field a view of the same schedule risk in a form they can actually use.
A full CPM schedule shows everything. A field-friendly view should show the work sequence currently driving, or most likely to drive, the next milestone.
That changes the conversation. Instead of asking a superintendent to extract the important issues from hundreds or thousands of activity lines, the team starts with a more useful question:
What sequence of work must hold to protect the next milestone, and where is it fragile?
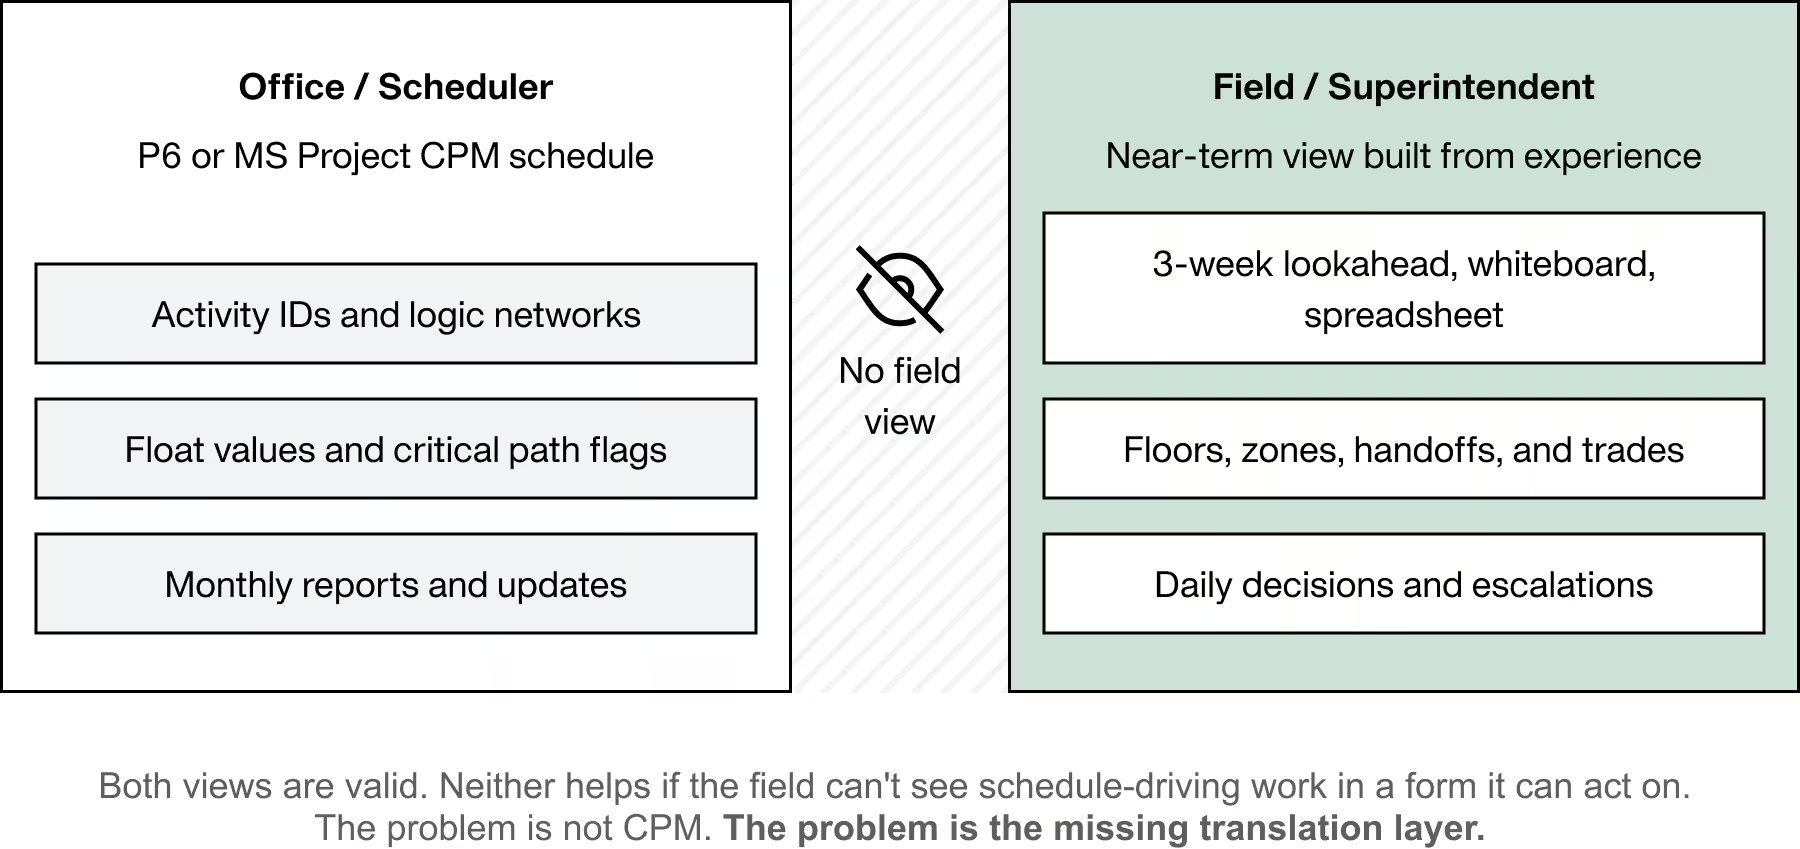
That produces a milestone path view. It is not a summary of the whole schedule. It is a filter that isolates the work the team needs to protect now.
What a Milestone Path View Should Show
A practical milestone path view should include:
- The milestone. Date, owner, and definition of done.
- The work sequence driving that milestone. The tasks or handoffs currently controlling, or most likely to control, the date.
- The area or phase. Floor, zone, phase, or turnover area so the field can immediately place the work.
- The responsible person. A named person for each near-term task or handoff.
A good field view may also show near-critical work if a small slip could move it onto the milestone-driving path. That keeps the team from focusing too narrowly on only one chain while missing the next risk that is about to become critical.
Float is a real and useful scheduling concept. But in the field, raw float values often do not help much unless they are translated into something easier to act on.
Telling a foreman there are 14 days of float on a path is technically correct. It still does not tell the team whether that protection is stable, shrinking, or nearly gone.
That is why many teams benefit from a simpler visual layer that shows schedule protection as a condition, not just a number.
A Simple Three-Zone View
One practical way to do this is a three-zone view:
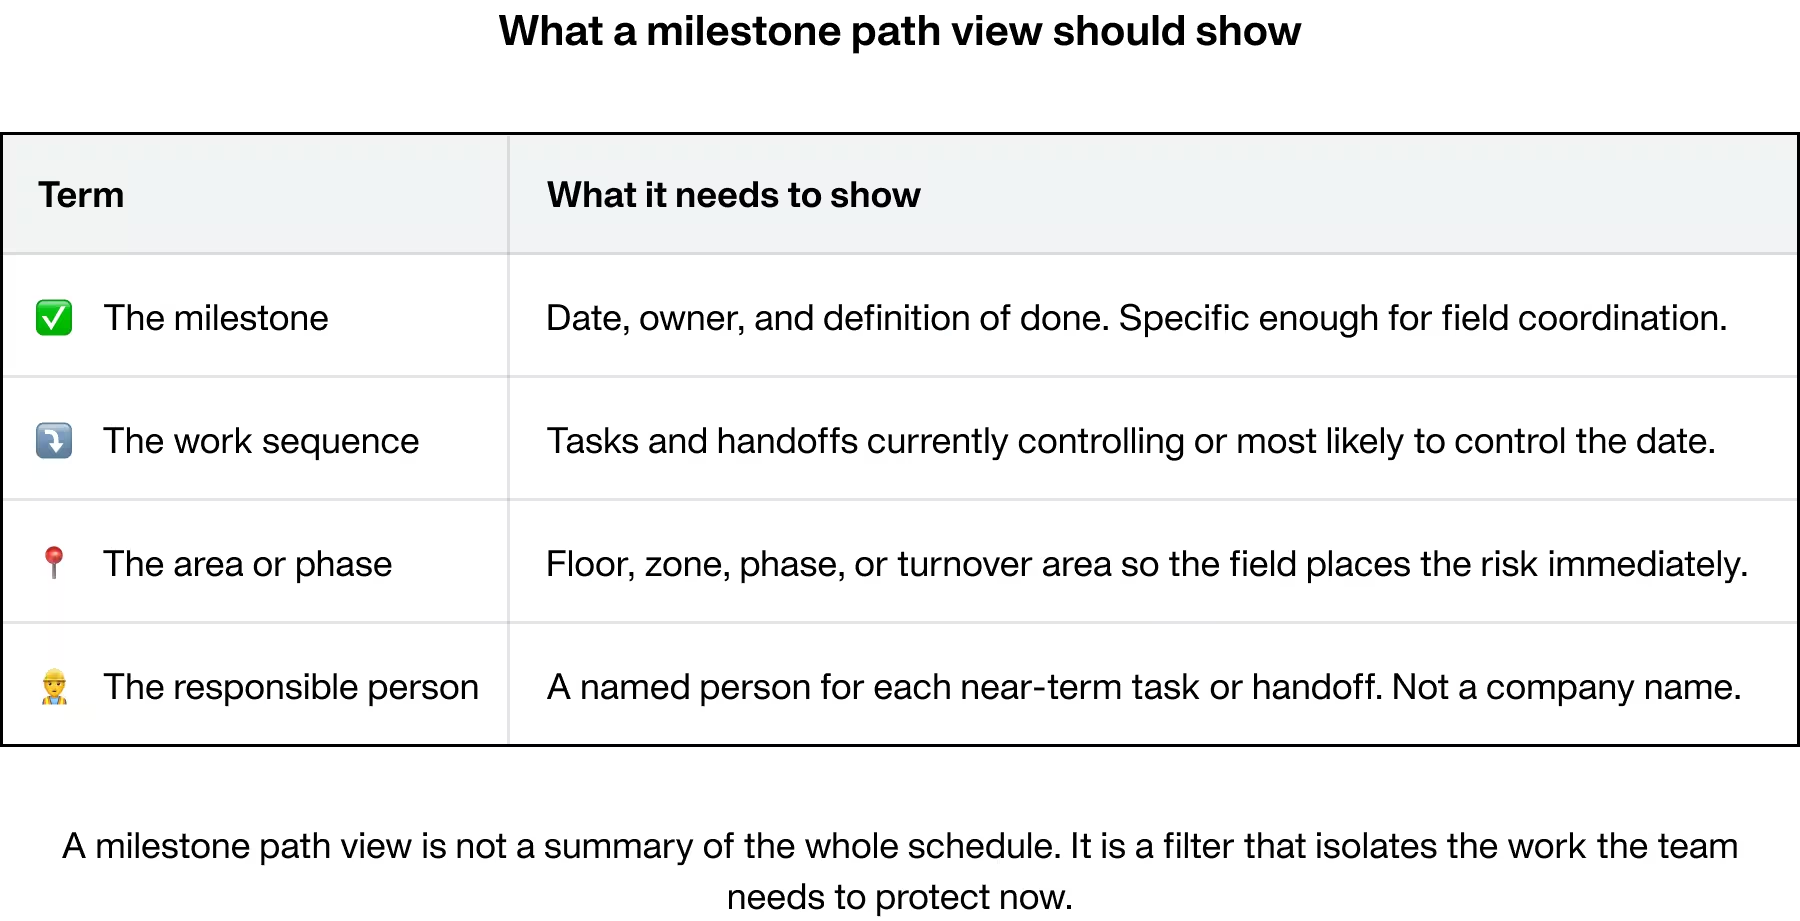
- Green. Schedule protection is healthy and the current pace is holding.
- Yellow. Schedule protection is tightening and the team needs to act before the milestone is exposed.
- Red. Little or no schedule protection remains, and the work is now directly threatening the milestone.
For field conversations, many teams also find it useful to translate float and forecast movement into simpler milestone protection language such as remaining buffer and burn rate.
- Remaining buffer shows how much schedule protection remains between current performance and the committed milestone date.
- Burn rate shows how quickly that protection is being consumed based on recent performance.
This does not replace the scheduling math. It makes the condition easier to understand in a weekly meeting or a morning huddle.
The field does not need raw float values first. It needs a condition signal that answers a more practical question: are we healthy, tightening, or already exposed?
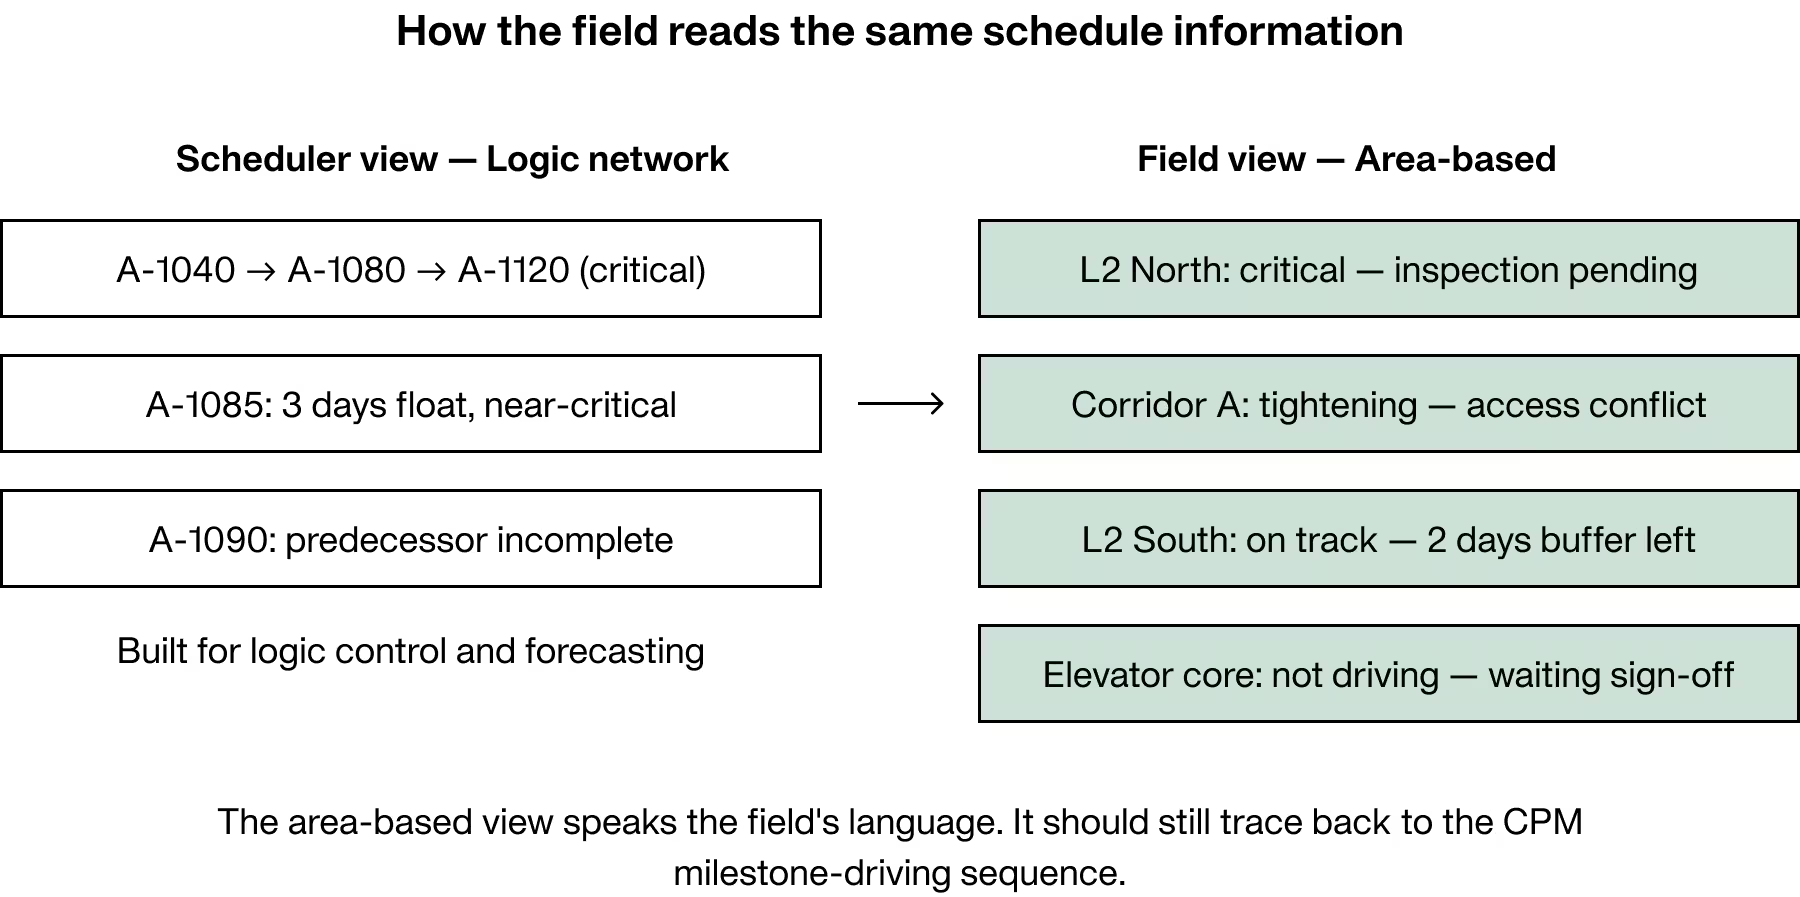
CPM schedules organize work by logic. Field teams organize work by location.
Schedulers think in predecessor and successor relationships. Supers and foremen think in floors, zones, grid lines, phases, and handoffs.
Those are two different views of the same project. If they are not connected, the field has to translate the logic network into physical work areas before it can act.
That is why area-based views matter.
Why the Area-Based View Works Better in the Field
A superintendent does not usually think in terms of activity IDs. The superintendent thinks about whether Level 2 North can hand off to MEP, whether inspection is ready before drywall shows up, and whether one blocked corridor is now affecting the rest of the floor.
An area-based critical work view speaks that language directly.
For example:
- Level 2 North: critical, inspection pending, drywall handoff at risk
- Level 2 South: on track, two days of schedule protection remaining
- Corridor A: schedule protection tightening, access conflict flagged
- Elevator core: not currently driving the milestone, waiting on structural sign-off
Location-based views often fit field supervision better because the work is being managed by floor, zone, sequence, and handoff, not by abstract activity numbers.
The area-based view should still trace back to schedule logic. That way the field sees location-based risk without losing connection to the milestone-driving sequence in the CPM schedule.
Visualization is only half the job. The value appears when the milestone path changes what the team commits to each week.
A clean visual view that sits beside a disconnected lookahead or weekly planning process does not solve much. The milestone path has to feed weekly work planning, constraint review, and reliability tracking.
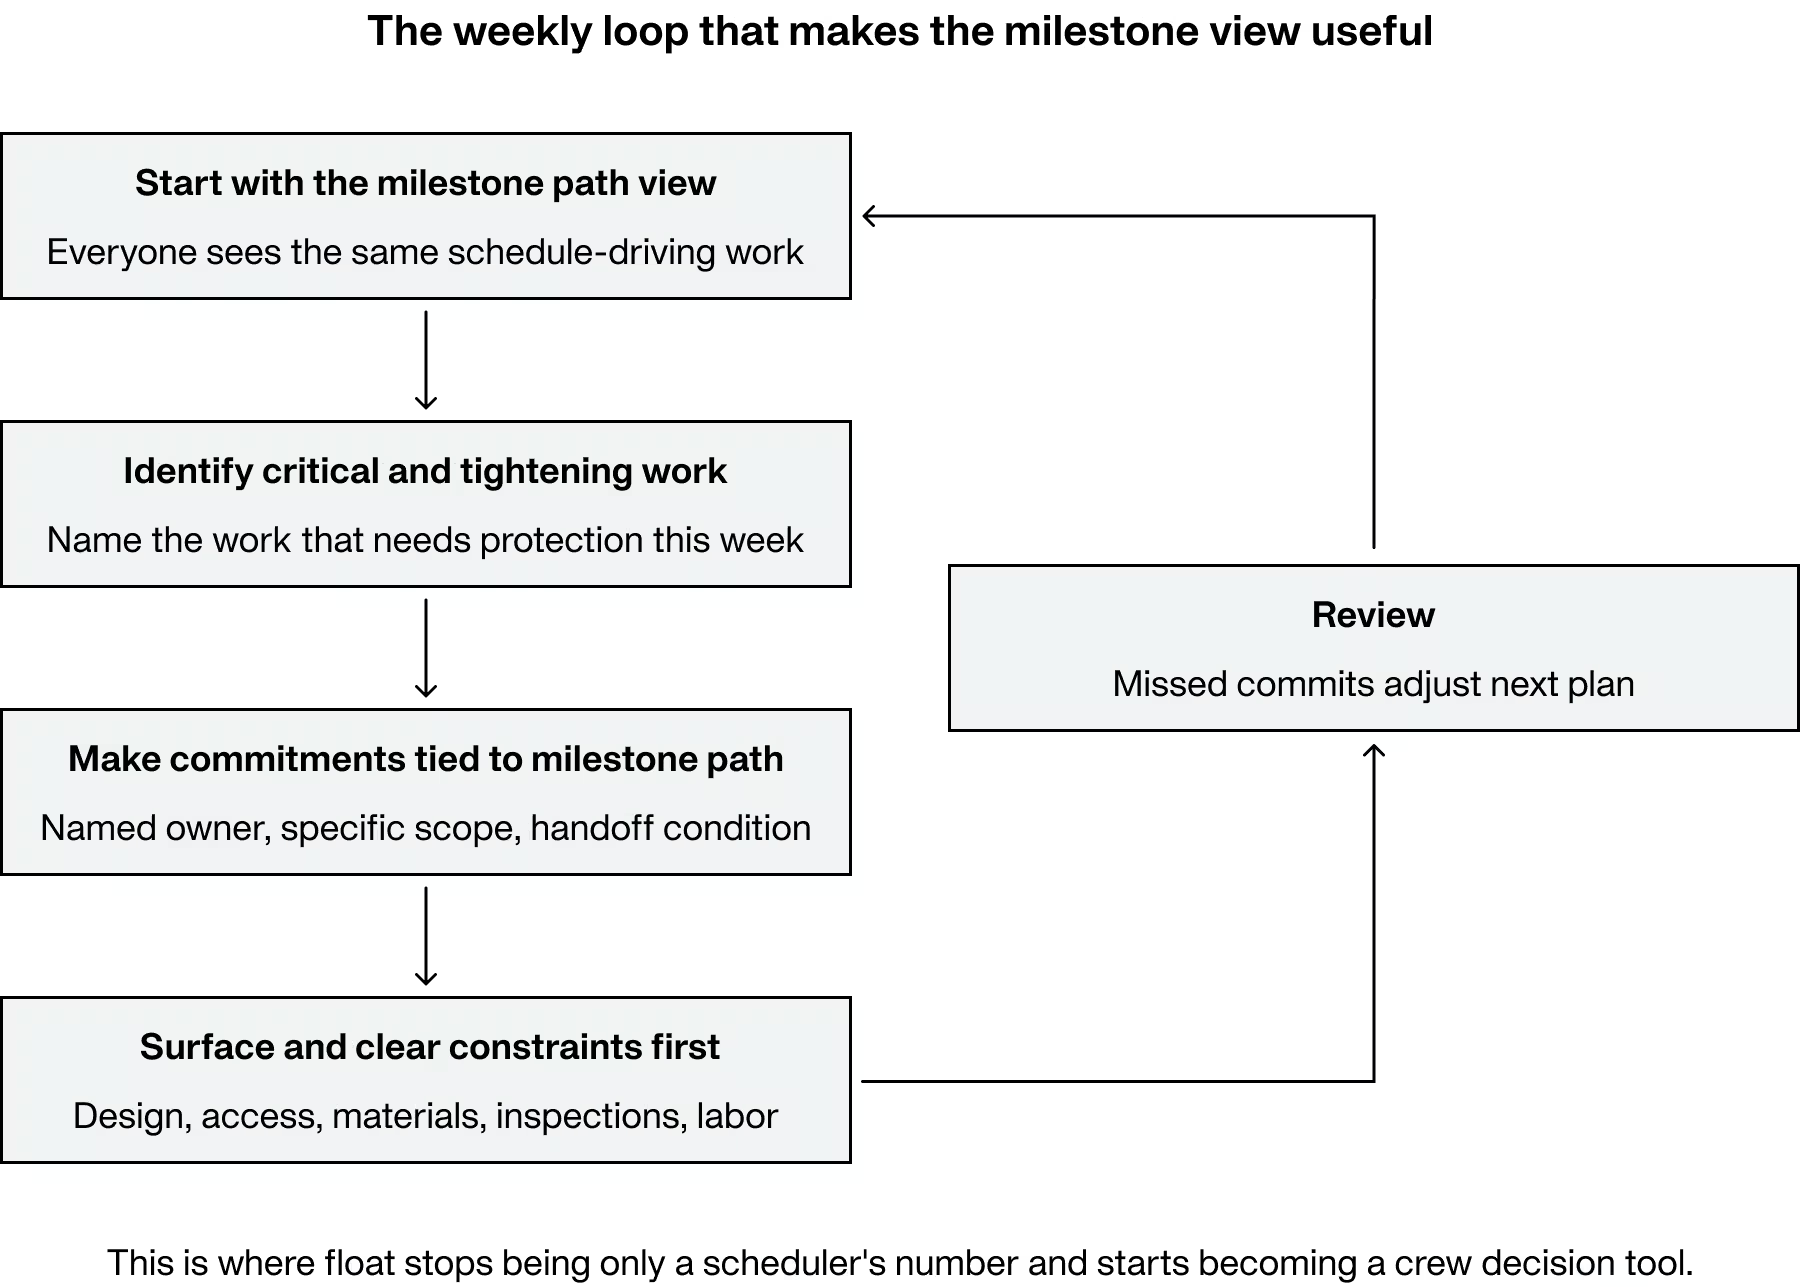
The Weekly Loop That Makes the View Useful
A practical workflow looks like this:
- Start the weekly planning meeting with the milestone path view. Everyone sees the same schedule-driving work.
- Identify what is critical and what is tightening. Name the work that needs protection this week.
- Make weekly commitments that protect the milestone path. Not vague updates like “continue work in area,” but specific promises tied to a handoff, area, and finish condition.
- Surface the constraints threatening those commitments. Design, access, materials, inspections, predecessor work, and labor all need to be visible.
- Review what held and what broke. Use missed commitments and reasons for variance to adjust the next plan before the milestone moves.
This is where float stops being only a scheduler’s number and starts becoming a crew decision tool.
The field does not need to hear about critical path after the fact. It needs a way to manage milestone-driving work while there is still time to protect it.
The through-line across all of this is simple. The field is not the problem. The interface is.
Field leaders make constant decisions about sequence, priorities, manpower, escalation, access, and trade coordination. When those decisions happen without a clear view of milestone-driving work, schedule risk stays hidden until it has already become expensive.
Give the same team a milestone path view, a clear condition signal for schedule protection, an area-based map of critical work, and a weekly planning loop tied to all of it, and the quality of those decisions improves.
Conversations get faster. Escalations happen earlier. Recovery options stay open longer. And the schedule becomes something the field can help protect, not just something the office reports on.
When the field can see it, they can protect it. And when they are protecting it, the schedule stops being just a document and starts becoming a shared plan.
How to Fix the Disconnect Between the Office and Field.
Download the report to learn more:
- Learn about the why scheduling and planning fail the field
- Understand the pain points, inefficiencies, and evolving practices shaping scheduling today
- Find out how to bridge critical disconnects happening in construction
You do not need to rebuild the whole CPM schedule to improve field visibility this week. Start by translating one milestone into a field-usable view.
- Pick the next milestone and build a milestone path view that shows only the work sequence currently driving, or most likely to drive, that date.
- Label that work by floor, zone, phase, or turnover area so the field can locate the risk immediately.
- Add a simple green, yellow, red condition signal for schedule protection and discuss whether it is stable, tightening, or exposed.
- Tie this week’s commitments directly to the milestone path, with named owners, specific scope, and clear handoff conditions.
- Review the constraints threatening that path first, and clear them before they compress downstream work.
- Watch near-critical work too, especially where small slips could move it onto the milestone-driving path.
Construction will always carry variability. That is not the problem to manage. The problem is schedule risk that stays invisible to the people doing the work, and that problem is solvable, one milestone path at a time.
When the field can see it, they can protect it. And when they are protecting it, the schedule is not a document anymore. It is a shared plan.
How to Fix the Disconnect Between the Office and Field.
You do not need to rebuild the whole CPM schedule to improve field visibility this week. Start by translating one milestone into a field-usable view.
- Pick the next milestone and build a milestone path view that shows only the work sequence currently driving, or most likely to drive, that date.
- Label that work by floor, zone, phase, or turnover area so the field can locate the risk immediately.
- Add a simple green, yellow, red condition signal for schedule protection and discuss whether it is stable, tightening, or exposed.
- Tie this week’s commitments directly to the milestone path, with named owners, specific scope, and clear handoff conditions.
- Review the constraints threatening that path first, and clear them before they compress downstream work.
- Watch near-critical work too, especially where small slips could move it onto the milestone-driving path.
Construction will always carry variability. That is not the problem to manage. The problem is schedule risk that stays invisible to the people doing the work, and that problem is solvable, one milestone path at a time.
When the field can see it, they can protect it. And when they are protecting it, the schedule is not a document anymore. It is a shared plan.
Frequently Asked Questions
A milestone path is the sequence of work and handoffs most likely to control the next milestone date.
Raw float does not show pace, trend, or exposure. A simple green, yellow, red signal supports faster decisions.
Milestone date and definition of done, the driving work sequence, area or phase labels, and a named owner for each near-term handoff.
Supers manage by floors, zones, phases, and handoffs. Location labels make risk visible where crews work.
Start the meeting with the milestone path, set specific commitments tied to areas and handoffs, surface constraints early, then review misses and causes to adjust next week.


Ready to see Outbuild?
Join hundreds of contractors from 10+ countries that are saving money by scheduling better

We’ll be in touch soon!